Uses of Correlation and Regression
| Home | | Advanced Mathematics |Chapter: Biostatistics for the Health Sciences: Correlation, Linear Regression, and Logistic Regression
The Pearson correlation coefficient (ρ), is a population parameter that measures the degree of association between two variables.
USES OF CORRELATION AND REGRESSION
The Pearson correlation coefficient (ρ), is a population parameter that measures the degree of association between two variables. It is a natural parameter for a distribution called the bivariate normal distribution. Briefly, the bivariate normal distribution is a probability distribution for X and Y that has normal distributions for both X and Y and a special form for the density function for the variable pairs. This form al-lows for positive or negative dependence between X and Y.
The Pearson correlation coefficient is used for assessing the linear (straight line) association between an X and a Y variable, and requires interval or ratio measurement. The symbol for the sample correlation coefficient is r, which is the sample estimate of r that can be obtained from a sample of pairs (X, Y) of values for X and Y. The correlation varies from negative one to positive one (–1 ≤ r ≤ +1). A correlation of + 1 or –1 refers to a perfect positive or negative X, Y relationship, respectively (refer to Figures 12.1A and 12.1B). Data falling exactly on a straight line indicates that |r| = 1.
The reader should remember that correlation coefficients merely indicate association between X and Y, and not causation. If |r| = 1, then all the sample data fall exactly on a straight line. This one-to-one association observed for the sample data does not necessarily mean that |ρ| = 1; but if the number of pairs is large, a high value for r suggests that the correlation between the variable pairs in the population is high.
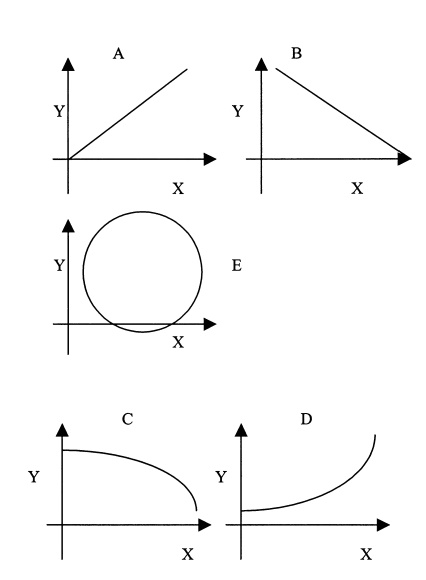
Figure 12.1. Examples of bivariate associations.
Previously, we defined the term “variance” and saw that it is a special parameter of a univariate normal distribution. With respect to correlation and regression, we will be considering the bivariate normal distribution. Just as the univariate normal distribution has mean and variance as natural parameters in the density function, so too is the correlation coefficient a natural parameter of the bivariate normal distribution. This point will be discussed later in this chapter.
Many biomedical examples call for the use of correlation coefficients: A physician might want to know whether there is an association between total serum cholesterol values and triglycerides. A medical school admission committee might want to study whether there is a correlation between grade point averages of graduates and MCAT scores at admission. In psychiatry, interval scales are used to mea-sure stress and personality characteristics such as affective states. For example, re-searchers have studied the correlation between Center for Epidemiologic Studies Depression (CESD) scores (a measure of depressive symptoms) and stressful life events measures.
Regression analysis is very closely related to linear correlation analysis. In fact, we will learn that the formulae for correlation coefficients and the slope of a regres-sion line are similar and functionally related. Thus far we have dealt with bivariate examples, but linear regression can extend to more than one predictor variable. The linearity requirement in the model is for the regression coefficients and not for the predictor variables. We will provide more information on multiple regression in Section 12.9.
Investigators use regression analysis very widely in the biomedical sciences. As noted previously, the researchers use an independent variable to predict a dependent variable. For example, regression analysis may be used to assess a dose–response relationship for a drug administered to laboratory animals. The drug dose would be considered the independent variable, and the response chosen would be the depen-dent variable. A dose–response relationship is a type of relationship in which in-creasing doses of a substance produce increasing biological responses; e.g., the re-lationship between number of cigarettes consumed and incidence of lung cancer is considered to be a dose–response relationship.
Related Topics
