The Special Case of 2 × 2 Contingency Table
| Home | | Advanced Mathematics |Chapter: Biostatistics for the Health Sciences: Categorical Data and Chi-Square Tests
Many situations in biomedical research call for the use of a 2 × 2 contingency table in which the researcher might be comparing two levels of a study condition, such as treatment and control, and two levels of an outcome, such as yes/no or dead/alive.
THE SPECIAL CASE OF THE 2 × 2 CONTINGENCY TABLE
Many situations in biomedical research call for the
use of a 2 × 2 contingency table (Table 11.7) in which the researcher might be
comparing two levels of a study condition, such as treatment and control, and
two levels of an outcome, such as yes/no
or dead/alive. By using algebra, the formula for chi-square has been greatly
simpli-fied for easy computation. The calculation formula has many applications
in epi-demiologic research settings.
In a 2 × 2 table we use an independent chi-square
test, where chi-square = Σ(|O – E| – 1/2)2/E. The term “1/2” is called Yates’
correction and provides a more precise estimate
of chi-square when there are only two rows and columns.
By algebra, the calculation formula for a 2 × 2 χ2 is:
χ2(df = 1) = (|ad –bc| – N/2)2N / (a + b)(c + d)(a + c)(b + d)
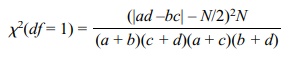
where df
= 1, χ2 critical = 3.84, and α = 0.05.
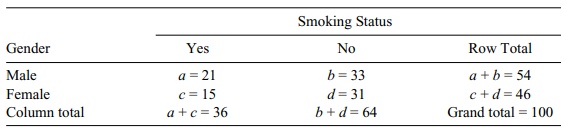
Now let us apply the calculation formula to a
specific example. Data shown in Table 11.8 reflect the number of male and
female smokers between two hypotheti-cal samples of males and females (n = 54 and n = 46, respectively).
If there is no association between gender and
smoking, one would expect that the deviations between the observed and expected
numbers of smokers and nonsmok-ers in each of the four cells are not statistically
significant. If there is an association, some of the cells will have
statistically significant deviations between the observed and expected
frequencies, which would suggest an association between smoking and gender.
Whether this association is likely or not likely to
be due to chance may be evalu-ated by the chi-square statistic. Using the data
in the bivariate 2 × 2 contingency table (Table 11.8),
x2 = (|21 × 31 – 15 × 33| – 100/2)2 100 /
(36) (64) (54) (46) = .196
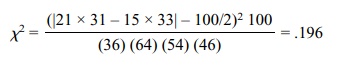
Because the calculated χ2 does not exceed the critical value (3.84), gender
does not appear to be related to smoking status.
TABLE 11.7. General 2 × 2 Contingency Table
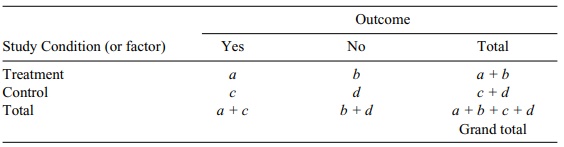
TABLE 11.8. Bivariate 2 × 2 Contingency Table
Related Topics
