Sign Test
| Home | | Advanced Mathematics |Chapter: Biostatistics for the Health Sciences: Nonparametric Methods
The sign test is very much like the signed-rank test, only simpler.
SIGN TEST
The sign test is very much like the signed-rank
test, only simpler. Again we com-pute the paired differences, but instead of
determining the ranks of the absolute dif-ferences we just keep track of the
number of positive (or negative differences). The sign of paired differences
will have a binomial distribution with parameter p. If we define p (the
binomial success parameter) to be the probability of a positive sign, and we
eliminate cases with zero for the paired difference, then the parameter p will be equal to 0.5 under the null
hypothesis. So the sign test is simply a test that a bi-nomial parameter p = 0.5, versus either a one-sided or
two-sided alternative. Let us look at the two examples from the previous
section to illustrate the sign test. First we will consider the temperature
data for the two cities and then the example of ag-gressiveness among twins.
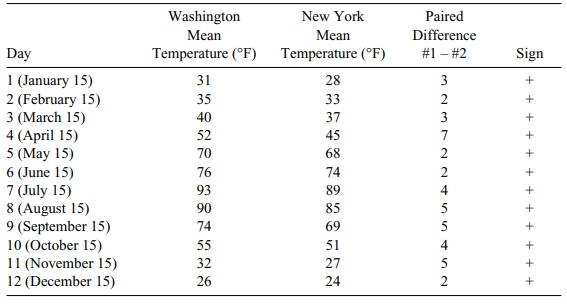
Referring to Table 14.6, we see that the number of
successes is 12, meaning that for every month the temperature was higher in
Washington than in New York. The p-value
for the test is defined as the probability of as extreme or a more extreme outcome than the observed one under the
null hypothesis. We see that the p-value
is (1/2)12 = 0.000244. Remember from Chapter 5 that this probability
is equivalent to the probability of 12 consecutive heads in a coin toss
experiment with a fair coin. From this information, we can see that the
significance of the test is less than p
= 0.05 or p = 0.001, indicating that
the differences are highly significant. In general, the sign test is not as
powerful as the signed-rank test because it disregards the in-formation in the
rank of the difference. Yet, in Table 14.6, the evidence is very strong that
the p-value is small, even for the
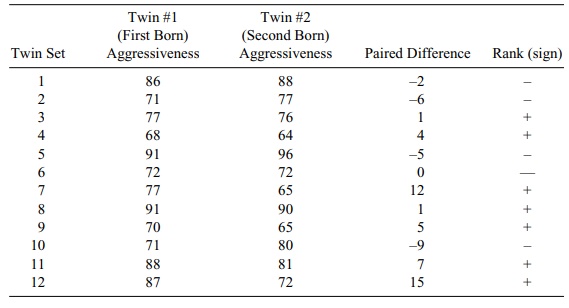
sign test. Now let us apply the sign test to the twin data (Table 14.7).
TABLE 14.6. Daily Temperatures for Two Cities
In this case, the p-value is the probability of getting 7 or more successes (shown in
Table 14.7 as 7 positive differences) in 11 trials when the binomial
probability of success is p = 0.50.
The probability of observing 7 or more successes in 11 trials when p = 0.50 is found to be 0.2744. So a p-value of 0.2744 indicates that the
ob-served number of successes easily could have happened by chance. Therefore,
we cannot reject the null hypothesis.
TABLE 14.7. Aggressiveness Scores for 12 Sets of Identical Twins
Related Topics
