Insensitivity of Rank Tests to Outliers
| Home | | Advanced Mathematics |Chapter: Biostatistics for the Health Sciences: Nonparametric Methods
Outliers are unusually large or small observations that fall outside the range of most of the measurements for a specific variable.
INSENSITIVITY OF RANK TESTS TO OUTLIERS
Outliers are unusually large or small observations
that fall outside the range of most of the measurements for a specific
variable. (Outliers in a bivariate scatter plot were illustrated in Chapter 12,
Figure 12.4) Outliers impact the parametric tests that we have studied in the
previous chapters of this text; for example, Z tests and t tests for
evaluating the differences between two means; ANOVAs for evaluating the
differ-ences among three or more means; and tests for nonzero regression slopes
and nonzero correlations. Rank tests are not sensitive to outliers because the
rank trans-formation replaces the most extreme observations with the highest or
lowest rank, depending on whether the outlier is in the upper or lower extreme
of the distribu-tion, respectively.
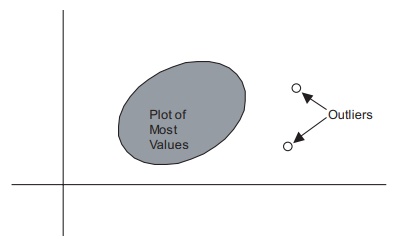
Figure 12.4. Scatter diagram with outliers.
In illustration, suppose that we have a data set
with 10 observations and a mean of 20, and that the next to the largest
observation is 24 and the smallest is 16, but the largest observation is 30. To
show that it is possible for this data set to have a mean of 20, we ask you to
consider the following ten values: 16, 16.5, 16.5, 16.5, 17, 19.5, 21, 23, 24,
30. Note that the sum is 200 and hence the mean is 20. Clearly, the largest
observation is an outlier because it differs from the mean by 10 more than the
entire range (only 8) of the other 9 observations. The difference between the
largest and the second largest observation is 6. However, the ranks of the
largest and second largest observations are 10 and 9, respectively. The
difference in rank between the largest and second largest observation is always
1, regardless of the magnitude of the actual difference between the original
observations prior to the transformation.
In conclusion, Chapter 14 has presented methods for
analyzing data that do not satisfy the assumptions of the parametric techniques
studied previously in this text. We called methods that are not dependent on
the underlying distributions of parent populations (i.e., distribution-free
methods) nonparametric techniques. Many of the nonparametric tests involved
ranking data instead of using their actual measure-ments. As a result of
ranking procedures, nonparametric tests lose information that is provided by
parametric tests. The Wilcoxon rank-sum test (also known as the Mann–Whitney
test) was used to evaluate the significance of differences between two
independently selected samples. The Wilcoxon signed-rank test was identified as
an analog to the paired t test. When
there were three or more independent groups, the Kruskal–Wallis test was
employed. Another nonparametric test discussed in this chapter was Spearman’s
rank order correlation coefficient. We also introduced per-mutation methods,
with Fisher’s exact test as an example.
Related Topics
